Chapter 7. The People of Papcastle
The first census was taken in 1801 but was limited to a head count only. This process continued every ten years until 1841, when the first detailed census was taken, recording people, household by household. Gender, age, occupation and a limited note of place of birth were required. In 1841, ages were recorded to the nearest multiple of five years. [1]
Later, the place of birth requirement was sharpened up and relationship to head-of-household included as well as condition (marital status). In 1851, it also asked whether blind or deaf-and-dumb; in 1861, this had extended to ask whether lunatic, imbecile or idiot ! In 1881, it was asking for how many rooms in the house if fewer than 5.
Monitoring sequential censuses, people were often very vague when they were born, and likewise their place of birth was likely to shift. And in every census, it recorded the people present, so that some might be found away from home, unless they were out of the country. The enumerators had to transcribe the official returns from drafts, supposedly filled in by the head of household, but where there was illiteracy or obstinacy to supplying the data, the enumerator had to guess and make the best of a bad job. So spellings of names and places of birth may be variable.
The census records have now been made available on-line once they are 100 years old, so that one can search for information between 1841 and 1901. There are limitations to these records but nevertheless they are a very valuable source of data. [1]
There is a major problem in that only the bigger dwellings seemed to have names, so that today’s practice where every house can be identified, seems not to have evolved until well into the 20th century.
An analysis of the censuses for the village from 1841 to 1901 shows some interesting features. Note however that until 1894, Papcastle was just part of the ecclesiastical parish of Bridekirk, and the Gote (Goat) area was included with it. Since the Gote was transferred to Cockermouth Urban District Council in 1935, and is now regarded as town, it has been excluded here, although in the earlier years it probably had a majority of the population recorded for Papcastle.
The first comparison is of the types of household. These have been classed in three groups.
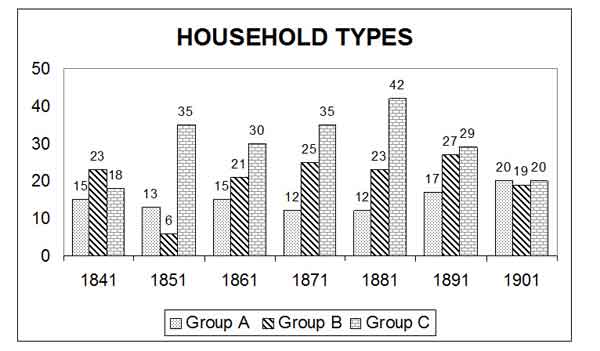
Chart 1: Types of Household
Group A: Landed proprietors, professionals (lawyers, army officers, medical men);
Group B: persons requiring education or apprenticed training to do their jobs – clergy, schoolmasters, craftsmen;
Group C: manual workers and the like- generally of little education
As indicated elsewhere, Papcastle was a choice location among the affluent and this is shown by the steady rise in the number describing themselves as “landed proprietors” or living off “funds”, i.e. those who did not have to work for a living. Today leaving aside the retired of whom there are plenty, there are probably no landed proprietors and the range of professionals has widened to embrace a great many in the village. At the other end of the scale, those in manual occupations showed a steady rise until 1881 but after this a steady decline, leading to today’s situation where very few of the households will fall in this category.
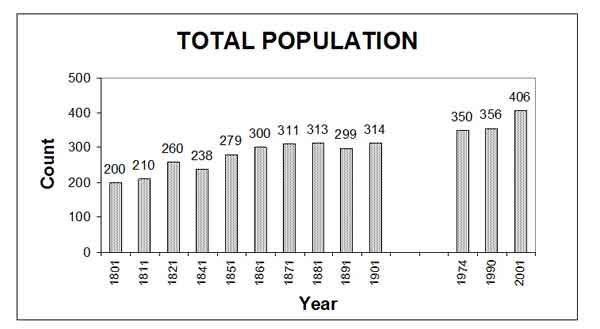
Chart 2: Total Population
Data sources for 1801 to 1821 are given in Notes and References [2]
The total population crept up during the 19th century, not surprisingly as the number of larger houses increased, each with their need for servants. Before 1841, one can only estimate the populations of the village proper, since the figures available include the Gote, which actually had more people than Papcastle. The growth continued into the 20th century with some 9 houses built in the inter-war period (1919-1939), at least 10 in the post-war period, 1945-65, 49 properties on the Mount, 16 at Castle Gardens and another 16 scattered around the village, before the end of the 20th century. This omits a considerable number of conversions of outbuildings to dwellings.
Note too that the figures for 1974 and 1990 do not include children.
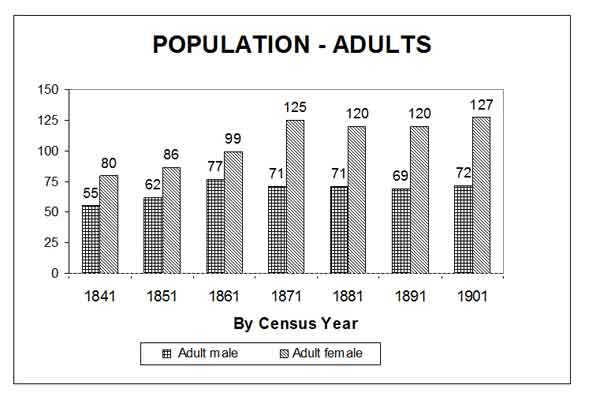
Chart 3: Adult Population
The most significant feature is the great mismatch between male and female adults. One must presume that much of this is due to the numbers of female domestic servants.
![Chart 4: Scholars and Infants [See also Appendix 2]](http://www.papcastle.org.uk/wp-content/uploads/2017/04/Chart-4.jpg)
Chart 4: Scholars and Infants [See also Appendix 2]
The number of scholars rose despite education not becoming compulsory until 1880. But after this there was a decline in the number of infants. Perhaps the large number of females was still here but aging beyond the child-bearing age.
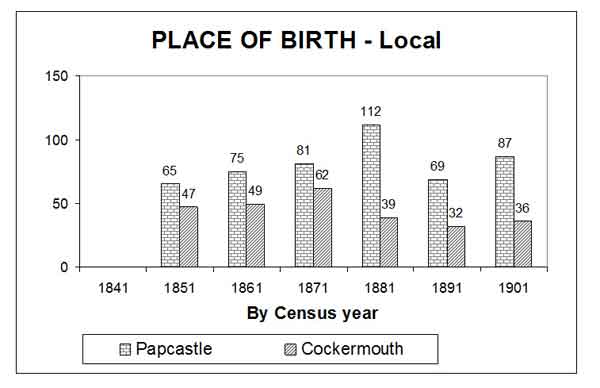
Chart 5
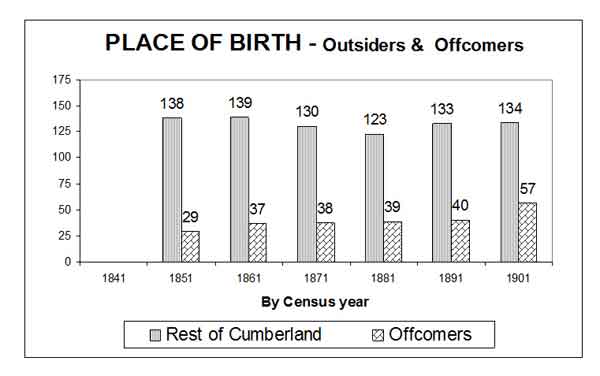
Chart 6
Chart 5 shows that less than one-third of the inhabitants had been born in the village, whilst Chart 6 shows the very regular movement in from other parts of the county. It also shows the steady growth of “off-comers”, born elsewhere, a trend which is probably much more exaggerated by the end of the 20th century.
Occupations
An attempt has been made to analyse the changing occupations of the villagers in the period 1841 to 1901. It is handicapped by a number of factors – the description given by the individuals themselves
– the possible effects of the enumerator, either prompting or writing down what he thought the answer should be – genuine movement into and away from the village.
The numbers below might be of interest.
| Occupation | Peak numbers |
| Mill workers | 21 in 1851 but reducing to 2 by 1901 |
| Gardeners | 13 in 1891 |
| Farm servants and labourers | 19 in 1871 |
| Farmers | 11 in 1891 |
| Solicitors | 4 from 1881-1901 |
| Independents (landed proprietors or persons living off own funds) | 24 in 1901 (but none reported in 1891) |
| House staff | Male 8 in 1881 (including 7 coachmen) Female 46 in 1861 falling to 31 in 1901 |
| Craftsmen | 15 in 1871 |
| Apprentices ( all trades) | 7 in 1881 but none in 1861 |
| Postmaster/mistress | 1 in 1871, 2 in 1901 |
| Innkeeper | 3 in 1861 |
CENSUS 2001
More recent information comes from this latest Census. [3]
POPULATION
| Papcastle | Cumbria | |
| All people | 406 | 487,607 |
| Males | 191 | 237,915 |
| Female | 215 | 249,692 |
AGE STRUCTURE
| Papcastle | Cumbria % | ||
| Number | % | ||
| 0-4 | 16 | 3.9 | 5.2 |
| 5-15 | 36 | 8.9 | 13.7 |
| 16-24 | 33 | 8.1 | 9.1 |
| 25-44 | 74 | 18.2 | 27.2 |
| 45-64 | 144 | 35.5 | 26.5 |
| 65-74 | 53 | 13.1 | 9.8 |
| 75+ | 50 | 12.3 | 8.5 |
The mean age in Papcastle from the 2001 census was 47.9 years, whilst the median age was 52.
GENERAL HEALTH AND CARE GIVERS
62 people (15.3%), indicated that they have a long term illness that limits their daily activities or the work they can do. In Cumbria, the percentage of people with a limiting long term illness is 20%. 290, or 71.4% indicated that their general health was good. In Cumbria, 67.1% of the total population were enjoying good health.
HOUSEHOLD DETAILS
In Papcastle, there are 181 household spaces with residents. There are also a further 3 which are vacant, and 6 which are either second or holiday homes. The average household size in this parish is 2.24 people.
DWELLING TYPE
| Papcastle | Cumbria % | ||
| Number | % | ||
| Detached | 98 | 51.6 | 25.4 |
| Semi detached or terraced | 77 | 40.5 | 63.3 |
| Flat/mobile home/other | 15 | 7.9 | 11.4 |
HOUSEHOLD TENURE
| Papcastle | Cumbria % | ||
| Number | % | ||
| Owner occupied | 145 | 80.1 | 72.3 |
| Social renting | 19 | 10.5 | 16 |
| Private renting | 17 | 9.4 | 11.7 |
HOUSEHOLD COMPOSITION
| Papcastle | Cumbria % | ||
| Number | % | ||
| Lone pensioners | 29 | 15.9 | 15.8 |
| Lone occupant non-pensioner | 17 | 9.3 | 14.2 |
| Lone parent with dependent children | 3 | 1.6 | 5.5 |
| Pensioner Households | 37 | 20.3 | 10.9 |
| Couples no children | 45 | 24.7 | 19.3 |
| Couples with dependent children | 29 | 15.9 | 22 |
| Households with non dependent children | 15 | 8.2 | 9.9 |
| Other households | 7 | 3.8 | 2.5 |
CAR OWNERSHIP
| Papcastle | Cumbria % | ||
| Number | % | ||
| No car or van | 24 | 13.2 | 24.4 |
| One car or van | 79 | 43.4 | 47.1 |
| Two cars or vans | 56 | 30.8 | 22.9 |
| Three cars or vans | 22 | 12.1 | 5.6 |
And two snippets from an earlier Parish Profile [4]
POPULATION DENSITY (1995)
| Papcastle | Cumbria | |
| Area (square hectares) | 449 | 682,354 |
| Population density (persons per hectare) | 1 | 0.7 |
| Sparsity banding # | Sparse | Sparse |
SINGLE PARENTS
| Papcastle % | Cumbria % | |
| Single parents | 0.0 | 6.7 |